My first touch to Power BI connected to Dynamics CRM
Some time ago we agreed with one of our customers that we will discontinue implementing the CRM reporting using the good old SSRS. We started looking for modern data analyzing and reporting tools out there. A few reasons led us to familiarize ourselves with the Microsoft Power BI. One of the reasons was that it looked quite simple to combine data from several different types of data sources and present the data in modern reporting view.
Another reason was that both our customer and our own organization have strong experience on implementing services on top of Microsoft technology stack, including O365. Some time ago, colleague of mine boasted his experiences with Microsoft Power Apps and how easy it had been to develop scalable web UI from which the data can be easily saved to almost any data store. So that was the third reason why I wanted to check out the Power BI, how it works under the hood and is it really as easy and straightforward as promised.
I have quite long background with Dynamics CRM. However the reporting side is one thing that I’ve worked probably the least during these years. Naturally reporting has been one vital part of almost all the projects, in one way or another. What good would the data within CRM be for anybody without proper views to it? I’ve noticed that some of the customers I’ve worked with, actually understand and consider the CRM UI views as “reports” as well. So the concept of “report” gets actually a bit blurry sometimes when discussing this subject with end users. When looking at it from the technical perspective, the “report” as a concept is clear. And it took me a while before I realized that a report can be understood very differently as well.
”We were tasked to fetch the data from two On Premise data sources and implement a report in O365-based Power BI.”
So back to the Power BI. The task we had at hand was that customer had O365 already deployed for several purposes. Email and intranet being the starting points. They had licenses already for Power BI so it was also a strong reason why to look at that direction as the future of reporting in that organization. Dynamics CRM was deployed as on premise deployment and IFD authentication was enabled. So CRM was one of the data sources for the first Power BI report. They also had data warehouse solution implemented on top of SQL Server and SQL Analysis Services. That would be the second data source for the report. So we were tasked to fetch the data from these two On Premise data sources and implement a report in O365-based Power BI. Possibly also to publish the report in customer’s O365 Sharepoint-based intranet.
”The surprising part of this whole installation and configuration experience was that it really was quite easy and straightforward to get it up and running”
After checking some material regarding Power BI, it seems that even during its rather short existence, the concepts and especially the terminology within it, has changed a bit. Currently the module or technology that is used to fetch the data in on premise data stores to the cloud is called On Premise Data Gateway. So I did a couple of test installations of it to our internal environments and configured it against our internal data stores. One of them being Dynamics CRM, another SQL Server DB and the third an excel file stored locally to a file server within our network. The surprising part of this whole installation and configuration experience was that it really was quite easy and straightforward to get it up and running. After installation, the needed steps were to configure the data sources including the service accounts to access the data sources and there it was, a “tunnel” between the cloud and On Premise data sources up and running.
Actually even before setting up the data gateway, I needed to familiarize with the Power BI workspace. A web application that actually works as the controlling center of the whole Power BI. At first it looked a bit strange because my initial understanding was that it is the place where the actual reports are also developed. In addition to controlling the Power BI in general, the workspace is actually used for configuring and presenting Power BI dashboards, something that can be used for visualizing data on reports.
For the report development, there is an additional application called Power BI desktop. That is the development “studio” of the Power BI. One having the knowledge of the data source structure, can very quickly develop the report using this application as it can be as easy as dragging and dropping things to proper places in canvas and off you go.
”Naturally there were some tricks and also some restrictions that came up during the implementation phase”
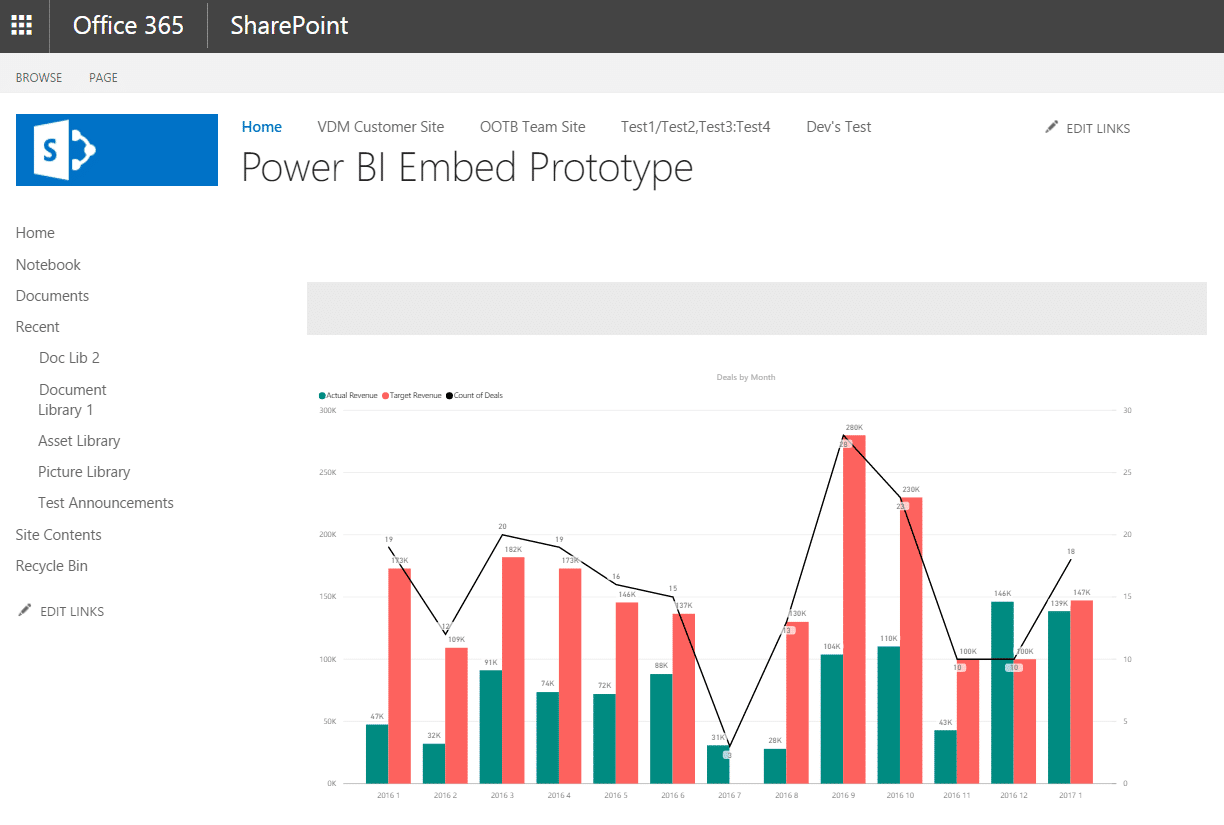
After spinning around the concepts, let’s get back to our project and the actual reason why I started to write this blog post. After familiarizing ourselves with the Power BI tools available, it was quite easy to have the infrastructure pieces up and running. Furthermore having knowledge of the Dynamics CRM implementation for this customer and the data structure within it, also the second part of the project was straightforward. That being the report implementation with the Power BI Desktop. Naturally there were some tricks and also some restrictions that came up during the implementation phase. One of those restrictions was related to having different scale for report graph y-axis on the left side than the right side which turned out that there can only be one type of graph element for one y-axis scale. But these are just something for which workaround is meant to be found (the usual stuff).
Oh, the end result? Here is a screen shot of one of the practices we did. This report gets its data from on premise Dynamics CRM and the report is published into O365-based Sharepoint site:
To summarize: Power BI seems to be keep its promise of being easy and straightforward to setup and get started with the report implementation. Naturally big part of the development is the knowledge of the data itself. It is quite impossible to develop a report without knowing the details of the data structure. But that’s of course something which you will run into regardless of the BI tool you use. While writing this blog post, I started to feel that this might actually be a series of blog posts. This one being the first scratch to the subject and our experiences with the wonderful world of Power BI. Within the next one, I’ll dig deeper to some specific area. That could be for example the On Premise Data Gateway and what actually happens in more detail when data flows from the ground up to the sky.
Follow us in a future as well!


